
My stats guru colleague Dr Andrew Pratley and I are on the move to tackle Quantifornication, the plucking of numbers out of thin air. Here is the fifth in a series we are co-writing.
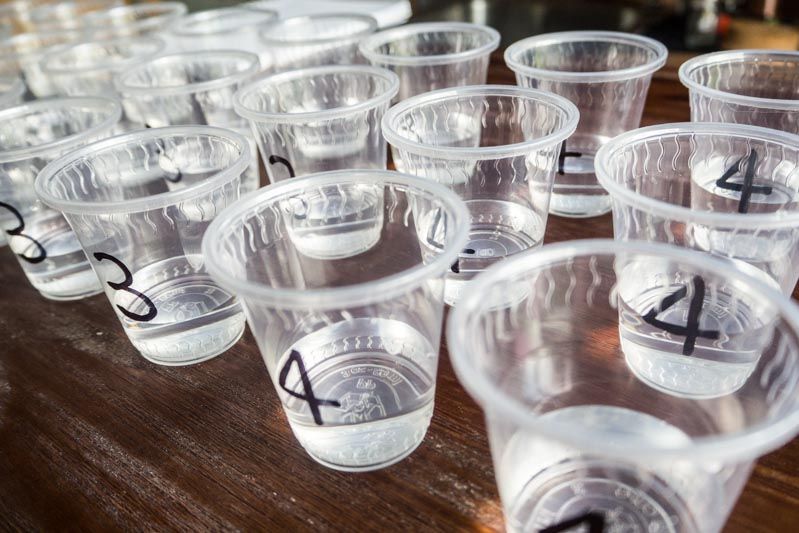
The story of statistics started with a question about differences. R.A. Fisher set out to test if someone really could taste the difference between tea where the milk was poured in before or after the tea. Fisher’s experimental design was simple. Eight cups of tea were prepared, four with the milk poured before, four with the milk poured after. Four were presented to Muriel Bristol in a random order. The lady correctly identified all four cups and Fisher came up with the mathematics to show that this result was extremely unlikely to occur by chance. The mathematics behind this became known as Fisher’s exact test.
Fisher went on to study crops and provided the framework for much of what we use today. The questions Fisher answered were related to many of the questions we’re interested in today. Fisher wanted to know if one type of fertiliser promoted faster crop growth than another. Or if the way the crops were planted impacted their growth, or the amount of water provided changed the yield. By understanding these, Fisher was able to determine how to make the best decision, when choices are available, based on statistical analysis.
All business leaders are making decisions between different approaches. Critically, and fortunately for us, we don’t need to be capable of developing statistical methods like Fisher, we just need to be able to apply them. While Fisher used pencil, pad and slide-rule, business leaders today have access to 90 years of research and development that are pretty well captured in Microsoft Excel.
The opportunity for professionals like you is to develop the ability to see situations and identify how statistical methods could be used. We tend to think statistics only apply to large data sets full of numbers. As the example at the start showed, Fisher was able to test if someone could tell the difference in how tea was prepared. Which informs people on how best to make tea for those who like the taste with the milk poured before or after. Fisher accomplished this without collecting a single number.
The questions you answer on differences could well be more profound and important than how to pour tea to your liking (unless you really like tea), but the underlying ideas remain the same. Statistical analysis doesn’t have to be something relegated to the too hard basket in the favour of other less accurate methods.
Stay safe and adapt – with better measurement!